Tutorial
The easiest way to use Crispulator is via the command line config file. If this format is too constraining, the Custom Simulations has a detailed walk- through of writing a custom simulation where each step can be modified according to need.
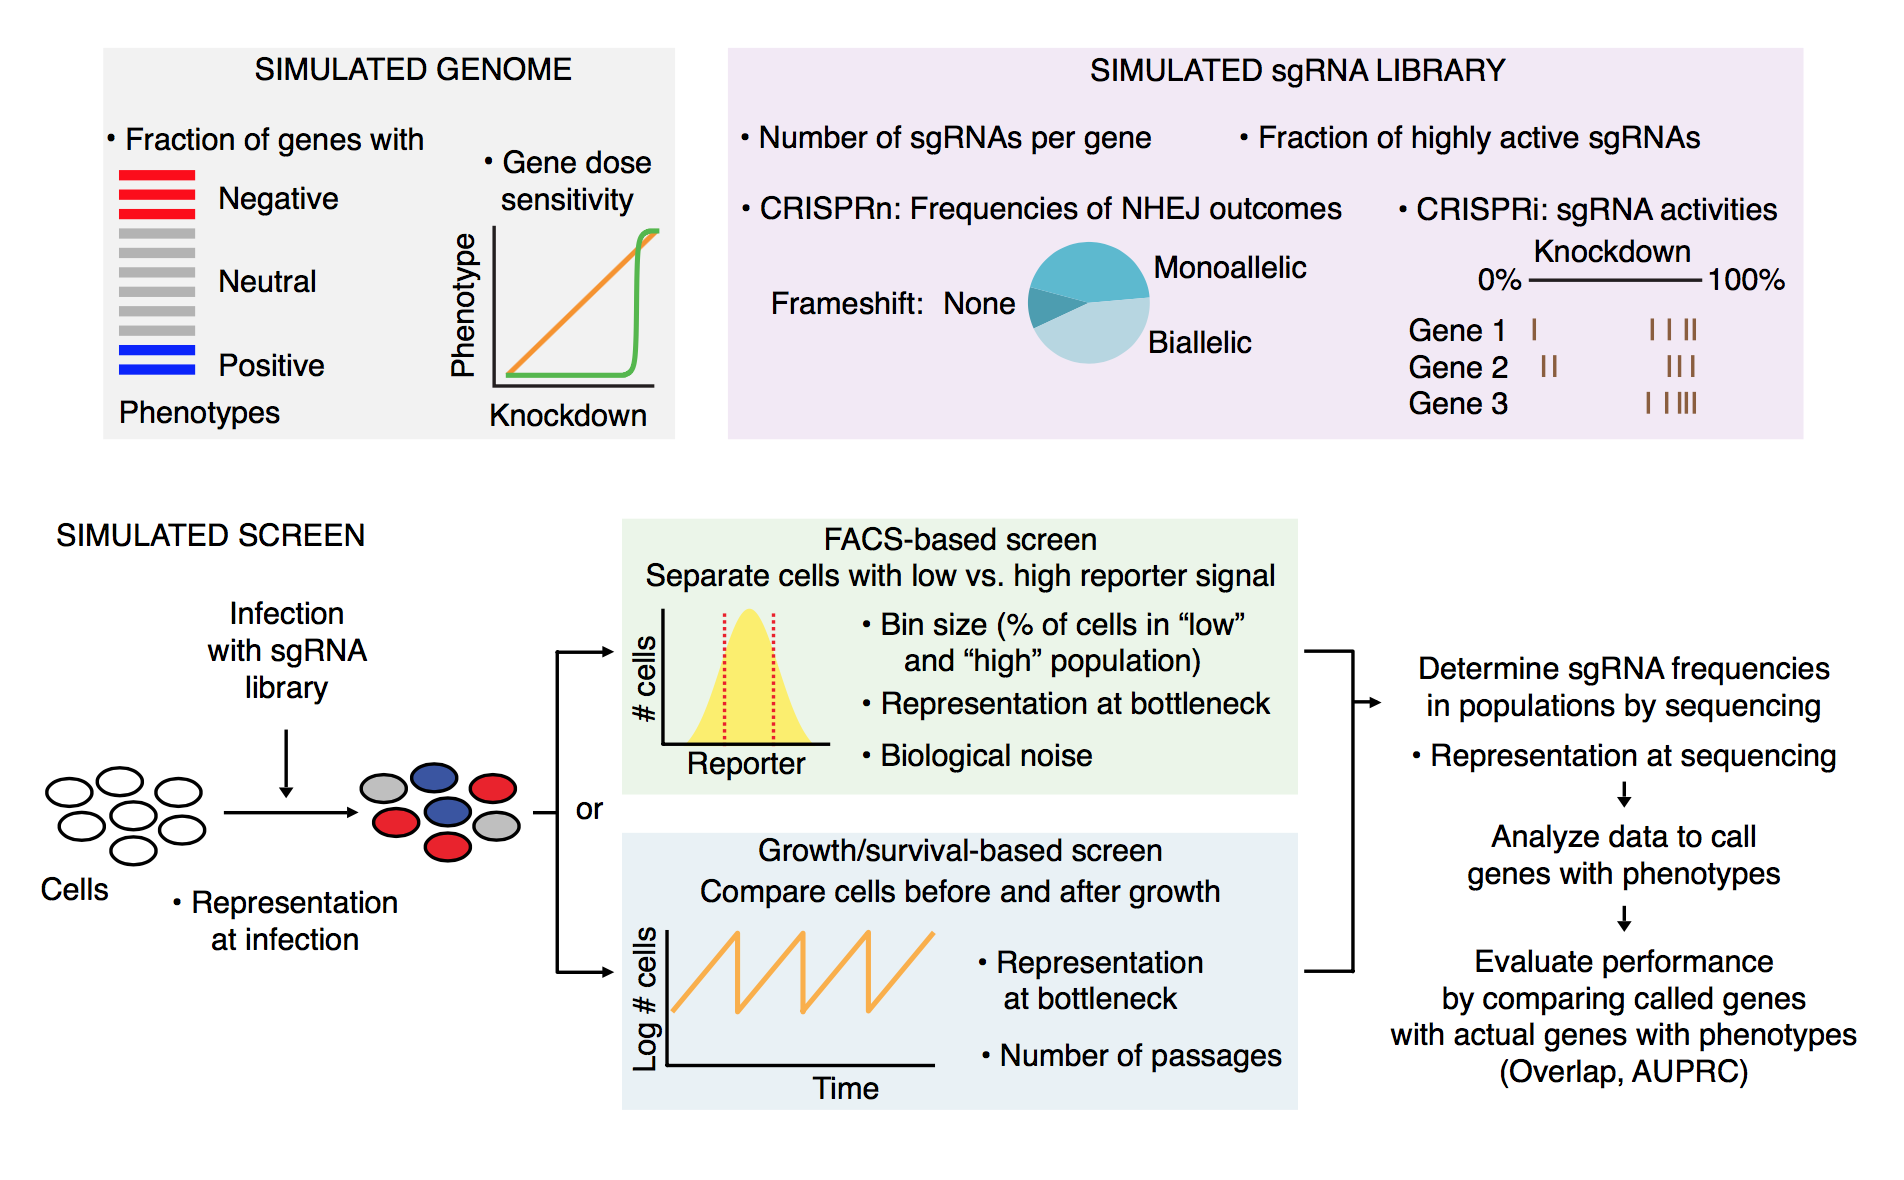
Graphical overview
The simulation is laid out in the following manner:
Getting started
First, navigate to the Crispulator directory.
You can find the directory by running
$ julia -e 'println(Pkg.dir("Crispulator"))'There should be a YAML file called example_config.yml. Open this is in a text editor and it should look like this
# This is an example configuration file. Whitespace is important.

# Settings pertaining to the library design
library:
    genome:
        num-genes: 500
        num-guides-per-gene: 5
        frac-increasing-genes: 0.02 # fraction of genes with a positive phenotype
        frac-decreasing-genes: 0.1 # fraction of genes with a negative phenotype

    guides:
        crispr-type: CRISPRn # either CRISPRi or CRISPRn
        frac-high-quality: 0.9 # fraction of high quality guides
        mean-high-quality-kd: 0.85 # mean knockdown by a high quality guide (CRISPRi only)

screen:
    type: facs # either facs or growth
    num-runs: 10 # how many independent runs

    representation: # integer value, how much larger are samples than the library
        - transfection: 100
        - selection: 100
        - sequencing: 100

# screen-type specific parameters

    bin-size: 0.25 # size of tail to sample from, must be between 0 and 0.5 (FACS only)
    std-noise: 1 # (FACS only)
    num-bottlenecks: 10 # (Growth only)
This gives access to most dials in the simulation, if something is missing than see Custom Simulations.
Now, lets remove all genes that have a positive phenotype by changing line 8 to 0.0:
frac-increasing-genes: 0.0 # fraction of genes with a positive phenotypeRunning simulation
Now, we can actually run the code by executing the following command
julia src/run.jl config example_config.yml test_outputHere config tells CRISPulator to use the provided config example_config.yml and test_output is the directory where the results will be saved. This directory will be created if it doesn't exist.
The output should look like
INFO: Directory test_output does not exist, attempting to create
INFO: Using 1 thread(s)
INFO: Loading simulation framework
INFO: Parsing config
INFO: Running config
INFO: Generating plots
INFO: Analyzing results
INFO: Saving results in test_output

Quick results:
##############
Venn score = 0.996, 95% conf int (0.987, 1.006)
AUPRC score = 0.929, 95% conf int (0.917, 0.942)
SNR score = 3.921 +/- 0.369
The test_output/ directory should now be populated with all the files
counts.svg
results_table.csv
volcano.svg
Output
The folder contains one of the raw count scatterplots (left) and a volcano plot of mean log2 fold change versus significance of each gene (right)


It also has a useful table that contains all the summary statistic information.
WARNING: readtable is deprecated, use CSV.read from the CSV package instead
Stacktrace:
 [1] depwarn(::String, ::Symbol) at ./deprecated.jl:70
 [2] #readtable#232(::Bool, ::Char, ::Array{Char,1}, ::Char, ::Array{String,1}, ::Array{String,1}, ::Array{String,1}, ::Bool, ::Int64, ::Array{Symbol,1}, ::Array{Any,1}, ::Bool, ::Char, ::Bool, ::Int64, ::Array{Int64,1}, ::Bool, ::Symbol, ::Bool, ::Bool, ::DataFrames.#readtable, ::String) at /home/travis/.julia/v0.6/DataFrames/src/deprecated.jl:1045
 [3] readtable(::String) at /home/travis/.julia/v0.6/DataFrames/src/deprecated.jl:1045
 [4] cd(::Documenter.Expanders.##8#10{Module}, ::String) at ./file.jl:70
 [5] (::Documenter.Utilities.##19#20{Documenter.Expanders.##7#9{Documenter.Documents.Page,Module},Base.PipeEndpoint,Base.PipeEndpoint,Pipe,Array{UInt8,1}})() at /home/travis/.julia/v0.6/Documenter/src/Utilities/Utilities.jl:593
 [6] withoutput(::Documenter.Expanders.##7#9{Documenter.Documents.Page,Module}) at /home/travis/.julia/v0.6/Documenter/src/Utilities/Utilities.jl:591
 [7] runner(::Type{Documenter.Expanders.ExampleBlocks}, ::Base.Markdown.Code, ::Documenter.Documents.Page, ::Documenter.Documents.Document) at /home/travis/.julia/v0.6/Documenter/src/Expanders.jl:478
 [8] dispatch(::Type{Documenter.Expanders.ExpanderPipeline}, ::Base.Markdown.Code, ::Vararg{Any,N} where N) at /home/travis/.julia/v0.6/Documenter/src/Selectors.jl:168
 [9] expand(::Documenter.Documents.Document) at /home/travis/.julia/v0.6/Documenter/src/Expanders.jl:31
 [10] runner(::Type{Documenter.Builder.ExpandTemplates}, ::Documenter.Documents.Document) at /home/travis/.julia/v0.6/Documenter/src/Builder.jl:178
 [11] dispatch(::Type{Documenter.Builder.DocumentPipeline}, ::Documenter.Documents.Document, ::Vararg{Documenter.Documents.Document,N} where N) at /home/travis/.julia/v0.6/Documenter/src/Selectors.jl:168
 [12] cd(::Documenter.##2#3{Documenter.Documents.Document}, ::String) at ./file.jl:70
 [13] #makedocs#1(::Bool, ::Array{Any,1}, ::Function) at /home/travis/.julia/v0.6/Documenter/src/Documenter.jl:203
 [14] (::Documenter.#kw##makedocs)(::Array{Any,1}, ::Documenter.#makedocs) at ./<missing>:0
 [15] include_from_node1(::String) at ./loading.jl:576
 [16] include(::String) at ./sysimg.jl:14
 [17] eval(::Module, ::Any) at ./boot.jl:235
 [18] process_options(::Base.JLOptions) at ./client.jl:286
 [19] _start() at ./client.jl:371
while loading /home/travis/.julia/v0.6/Crispulator/docs/make.jl, in expression starting on line 35
6×8 DataFrames.DataFrame. Omitted printing of 2 columns
│ Row │ method │ measure │ genetype  │ std_score │ mean_score │ conf_max │
├─────┼────────┼─────────┼───────────┼───────────┼────────────┼──────────┤
│ 1   │ venn   │ inc     │ sigmoidal │ NaN       │ NaN        │ NaN      │
│ 2   │ auprc  │ inc     │ sigmoidal │ NaN       │ NaN        │ NaN      │
│ 3   │ venn   │ dec     │ sigmoidal │ 0.0       │ 1.0        │ 1.0      │
│ 4   │ auprc  │ dec     │ sigmoidal │ 0.0382112 │ 0.955199   │ 0.986374 │
│ 5   │ venn   │ incdec  │ sigmoidal │ 0.0       │ 1.0        │ 1.0      │
│ 6   │ auprc  │ incdec  │ sigmoidal │ 0.0489821 │ 0.924908   │ 0.964871 │
The table below describes each column
| Column Name | Meaning |
|---|---|
method | Which summary statistic was used (e.g. Simulation.auprc) |
measure | Whether the score is only for increasing genes (inc), decreasing (dec) or both (incdec). Allows independent evaluation on which type of genes the screen can accurately evaluate. |
genetype | Whether the score is for linear, sigmoidal, or all genes (see Simulation.KDPhenotypeRelationship). Helps determine if CRISPRn or CRISPRi is better for this design. |
mean_score | Average score |
std_score | Standard deviation in scores |
conf_max | Upper limit of 95% confidence interval |
conf_min | Lower limit of 95% confidence interval |
n | Number of independent replicates |